For the more than 44 million Americans with disabilities, accessibility is critical to complete everyday functions. Yet despite 13% of the American population living with a disability, stigma and discrimination persist.
Using Census Bureau data, accessiBe charted disability statistics to give Americans a better idea of accommodations needed across the country.
Nearly everyone who lives long enough will eventually develop a disability, according to the World Health Organization. Census Bureau estimates from 2022 show that almost one-quarter of all Americans between the ages of 65 and 74 have disabilities, compared to nearly 13% of people between 35 and 64. Close to half of those 75 or older have some type of disability. As the U.S. population ages, accessibility will become increasingly important in American infrastructure and culture.
“Accessibility” and “accommodation” are two frequently used terms when referring to efforts to remove barriers for those living with disabilities. Accessibility refers to proactive measures to remove barriers while planning or designing an event, program, or structure. Accommodations are designed to retroactively correct barriers previously created in an inaccessible design.
Accessibility for those with disabilities has greatly improved since the Americans with Disabilities Act (ADA) was passed in 1990. In a Pew Research survey conducted in 2023, about 3 out of 4 workers who spend at least part of their time on-site said their workplaces are at least somewhat accessible for those with physical disabilities; more than half of respondents said their workplaces are very accessible. Access to and usage of specialized education and services for students with disabilities has also expanded significantly in the last 15 years.
The ADA was created to prevent discrimination against Americans living with disabilities. However, its implementation has benefits for the entire population. The ADA has elevated American society at large by dismantling discriminatory barriers to employment, increasing access to and through buildings, and expanding benefits like temporary medical leave.
Even with the ADA driving disability rights for more than 30 years, however, accessibility is not universal nor doled out equitably. One example can be found in earnings as workers with disabilities made record employment gains in 2023; but they still earn far less on average than those without disabilities, bringing home a median annual wage in 2022 of about $31,000 versus nearly $44,000 for those without disabilities.
Poverty disproportionately affects individuals with disabilities at twice the rate of those without: 20.4% versus 10.1%, respectively, according to Census Bureau data. Living with a disability makes other health concerns more likely, as well, including obesity, heart disease, and diabetes. Introducing poverty to that reality exacerbates health concerns for Americans with disabilities as about 1 in 4 people with disabilities ages 18-44 have unaddressed health needs due to cost, according to the Centers for Disease Control and Prevention. Reducing and simplifying medical expenses would bring a host of benefits to those living with disabilities as well as to the general population.
How the prevalence of disabilities compares nationally
People with disabilities may have co-occurring disabilities, such as being deaf and blind or having mobility difficulties that make it challenging to live independently.
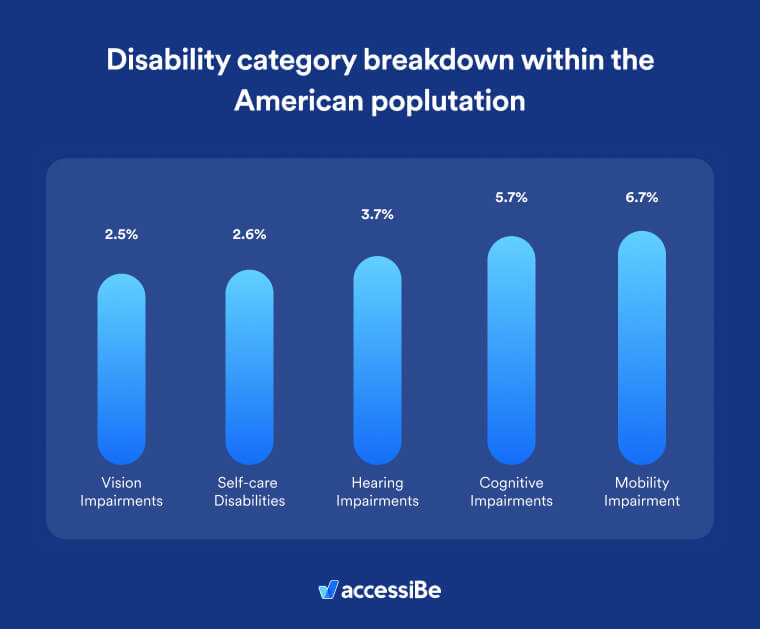
13.4% of Americans report having one or more disabilities, with the most common disability pertaining to mobility, as appears in the chart. Nearly 7% of Americans have conditions that prevent or impede walking. Ensuring accessibility for people with mobility issues results in the largest infrastructural changes, such as adding ramps and elevators to buildings, adding lifts to pools and hot tubs, and creating wheelchair spaces on public transit.
Supporting these individuals has also spurred advances in technology, such as increasingly advanced wheelchairs and vehicles that can be driven by those who don’t have full use of their feet. In the digital world, accessibility entails spacing text and buttons adequately to allow users to enlarge text or click precisely on what they intend to, removing time limitations, and avoiding mandatory drag-and-drop interfaces.
Disabilities that limit people’s ability to live independently (reported among 6% of Americans) are also common throughout the country. Independent-living disabilities include physical or mental limitations that prevent people from completing errands or household tasks. These, along with self-care disabilities, most often necessitate a caretaker, whether a live-in family member, an in-home aide, or admittance to a nursing home.
Individualized treatment plans, skill development training, and smart home technologies could help people with independent-living disabilities maintain their independence. In addition, flexible work schedules, remote work capabilities, and family and medical leave can create more opportunities for families to better support their loved ones with disabilities.
Nearly 6% of Americans have cognitive disabilities such as autism and dementia, which can cause difficulty concentrating or making decisions. To create accessibility for people with these conditions, people and institutions can communicate information in multiple modes: audio, text, and visuals. Website interfaces can provide multiple navigation options to ensure ease of access for anyone. Consistency, predictability, and simplicity in websites, signage, and other communications make them more accessible to people with these disabilities—and more straightforward for all viewers.
Hearing impairments (which impact 3.7% of Americans) are increasingly being represented in media, from blockbuster films like A Quiet Place to central characters in shows like Marvel’s Hawkeye and AMC’s The Walking Dead. Deaf and hard-of-hearing social media influencers are also spreading knowledge of American Sign Language. Subtitles are becoming more commonly used even among those who don’t have hearing impairments.
Accessibility has also improved for those with vision impairments, reported among 2.5% of Americans. People experiencing partial or full blindness have more access to increasingly specific alternative text/descriptions for images, speech recognition technology, integrated colorblind tests, and more.
Understanding the particular needs within communities is essential to eliminating bias and continuing to improve accessibility in the physical and digital worlds for all Americans.
Frequently asked questions about common types of disabilities in the U.S.
Q1. How many Americans live with one or more disabilities?
A1. Around 13% of Americans report having one or more disabilities. This includes difficulties in mobility, cognition, independent living, hearing, vision and self-care.
Q2. What is the most common type of disability in the U.S.?
A2. Mobility disability (i.e., serious difficulty walking or climbing stairs) is the most common category, affecting nearly 1 in 7 adults.
Q3. What other disability types are relatively prevalent?
A3. Cognitive disabilities (impacting memory, focus or decision-making) affect about 6% of adults. Independent-living difficulty (trouble doing errands alone) also sits around 6%. Hearing impairments affect roughly 3.7%, and vision impairments about 2.5% of adults.
Q4. Why does knowledge of disability prevalence matter for digital accessibility?
A4. Understanding which impairments are common helps organisations prioritise accessible design—for example, keyboard navigation for mobility issues, simple language for cognition, captions for hearing, alt text for vision. Accessibility then becomes aligned with real user needs.
Q5. How do disability trends link to user-experience and design obligations online?
A5. Since millions of people live with impairments that affect website use (like mobility or cognition), digital experiences must be built to include them. This means designing clear layouts, proper headings, alt text, captioning, predictable flows and keyboard support—so that no user is unintentionally excluded.
Q6. How can organisations use this data to strengthen their accessibility strategy?
A6. They can begin by mapping their digital assets (websites, apps) against known disability statistics, identifying high-impact user flows (login, checkout, forms), testing for mobility/cognitive/hearing/vision barriers, prioritising those fixes, and documenting efforts. Awareness of prevalence helps set remediation agendas.